Once you have created your portfolio, you can see all the details on this page.
Browse through all the features from this portfolio and see which teams are involved, which features are being actively worked on, and what the progress as well as the projected completion is.
You can directly go to the portfolio detail page if you bookmark the specific URL. Even if the portfolio name changes, the URL will stay the same.
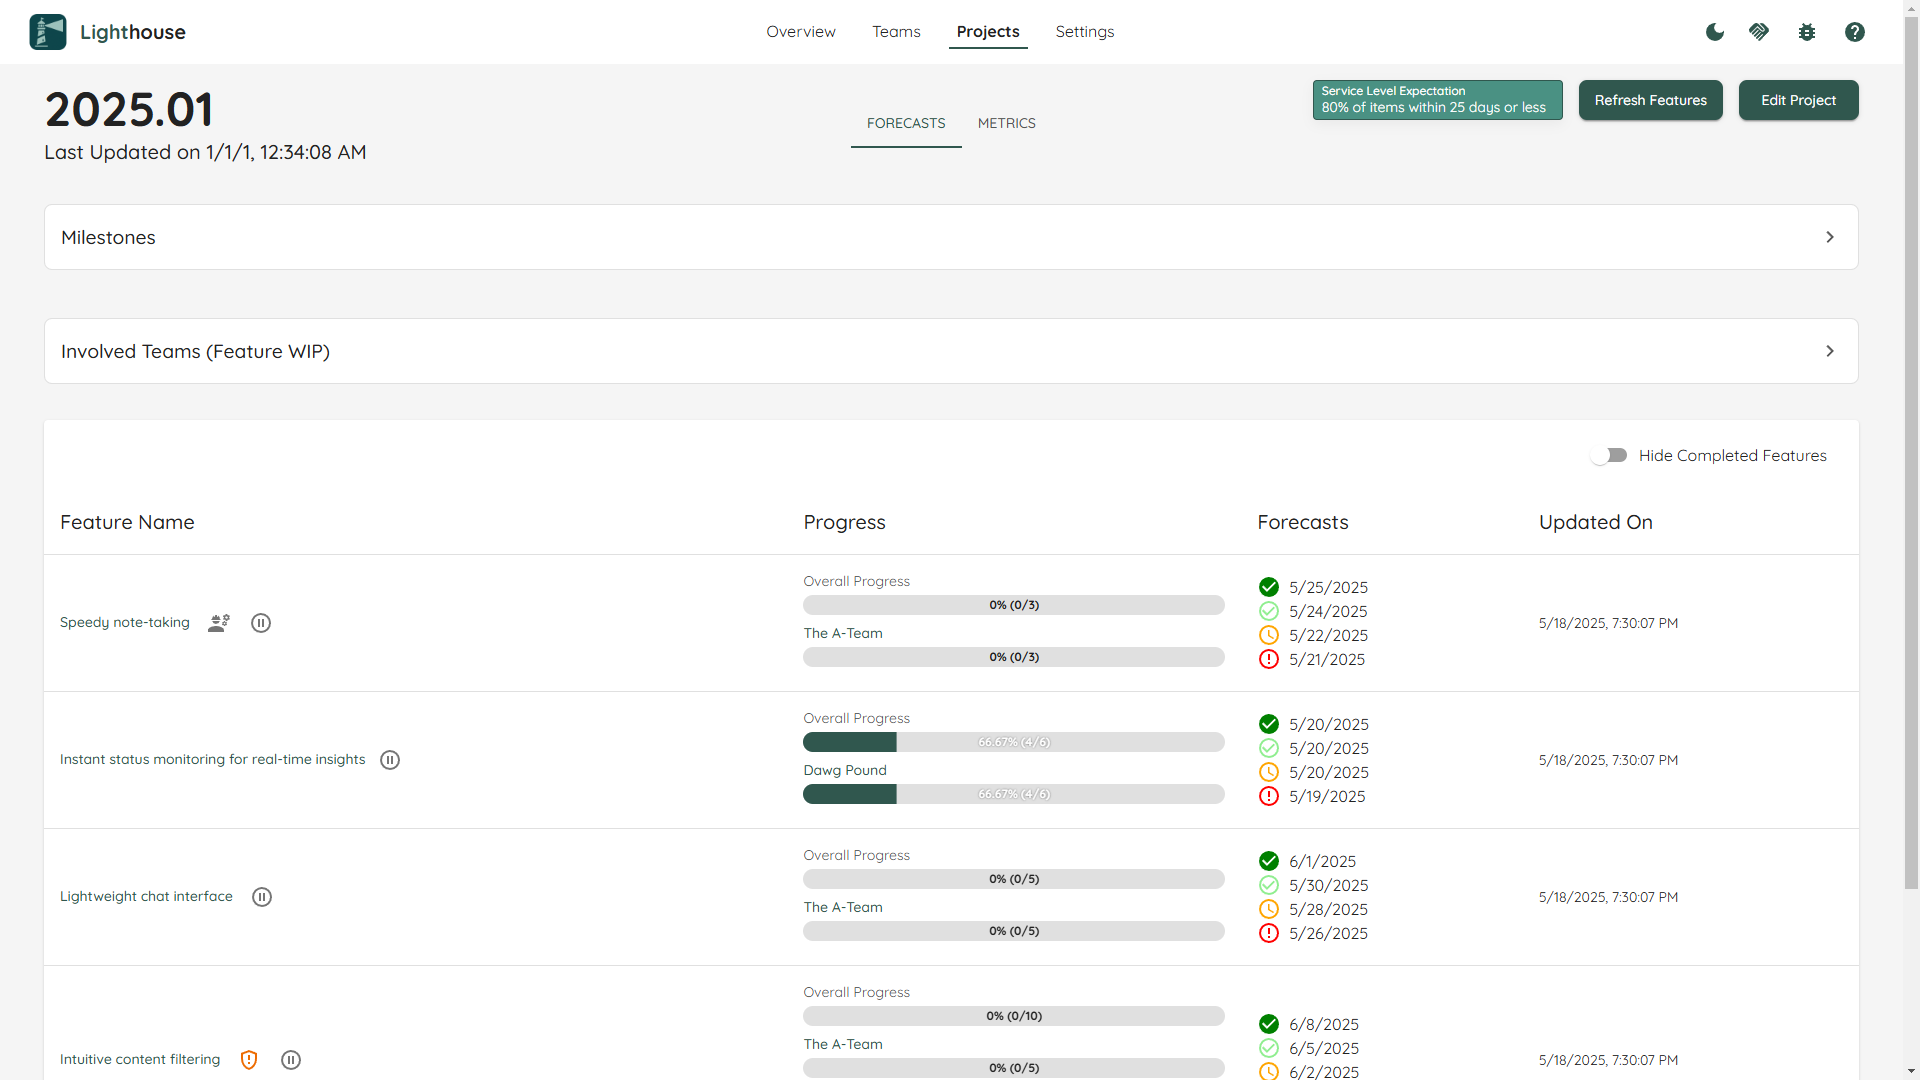
General Portfolio Information and Actions
On top you can see general portfolio information, which includes the name of the portfolio and it was last updated.
Refresh Features
While portfolios are continuously updated, you can trigger a refresh manually by clicking the refresh icon in the header. This will update the Features and all associated forecasts.
A manual refresh can be useful if you just made significant changes (for example added new features to the portfolios) and do not want to wait for the periodic update to kick in.
After you trigger the manual refresh, the refresh icon will be disabled while the portfolio is updated. Depending on the load of the server and other operations which might be in progress, it can take a while. While every context and portfolio is different, an update should normally not take longer than two minutes.
Settings
Portfolio settings are available in the Settings tab on the Portfolio page. They contain the same settings as the Portfolio Creation.
For frequently used adjustments there is a Quick Settings bar in the header that allows you to change common values (SLE, System WIP, Portfolio Feature WIP) without leaving the page.
Forecasts
Features
For every portfolio, all the features are listed with additional details.
Table Options
The Feature table offers two options that you can toggle on/off:
- Group Features by Parent
- Hide Completed Features
The settings will be stored for this specific portfolio, so next time you won’t have to toggle it off/on again.
Group Features by Parent
If this is toggled on, the Features will not be shown in a flat list, but grouped by their respective parents. This can be useful if your Features (for example Epics) have parent items that are of relevance to you. This could be something like an Initiative or Objective (if you use OKRs or some kind of quarterly planning).
Hide Completed Features
If you have many Features that are already completed, you may not want to show all of them. In such a scenario, you can hide the completed features.
Feature Order
Features are ordered based on the order in your Work Tracking System.
You can’t reorder Features in Lighthouse itself, but have to adjust your Work Tracking System and Refresh the Features.
The order is crucial, as Lighthouse forecasts based on the Feature WIP of each Team from highest to lowest ordered Feature.
If you have toggled on the Group Features by Parent, the respective Parent Features are shown in the order coming from your Work Tracking System.
Feature Name
The name of the feature. This is also a clickable link, that points to this specific item in your work tracking system.
Furthermore, there can be two indicators for each feature:
- A ⚠️ emoji symbolizes that this specific feature is using the Default Feature Size and is not broken down yet. Check the Portfolio Modification Page for details on what that means.
- A ⚙️ emoji symbolizes that there are child items of this specific feature that are currently being actively worked on (meaning they are in a Doing State) by any involved team.
In general you should be working on the top-most features, while the ones further down the order may not be broken down yet. If features on top are not yet broken down, this may be a signal that you should invest some time in breaking them down.
If features towards the bottom are in progress, you may focus on the wrong thing.Use Lighthouse to make such things transparent and trigger a discussion around what to focus on!
Feature Progress
In the progress column, you can see how many items are done and how many are pending for this feature. This is split by the total amount for the feature and a more detailed view for every involved team.
If a team is working solo on a feature, both bars will show the same numbers.
Forecasts
For each Feature you will see the forecasted completion date. You’ll get four different probabilities, from Certain to Risky. Naturally, the riskier the forecast, the earlier the projected completion.
The completion dates of each feature will take into account all teams that are involved. If a single item is planned to be done by one team, but this is far down their priority, this will mean that the feature completion will be moving backwards. Lighthouse cares about delivering complete features. You may be able to use such scenarios to kick off a discussion about how work or teams are sliced (as less dependencies mean more effective delivery).
Feature WIP
Lighthouse forecasts are based on the Order and the Feature WIP of each involved team. You can change this via the settings of a team or by using the Quick Settings bar in the portfolio header. Changing Feature WIP will automatically reforecast the completion dates.
Adjusting the Feature WIP for The A-Team from 1 to 3 caused the probabilities to change. In general, increasing the Feature WIP will mean that lower ordered features will be completed sooner, while higher ordered features take longer to finish.
A Feature WIP of 1 means, the team will only work on the top most feature, and move to the next one only when this is all done. The single focus of this team is on one feature.
On the other side of the extreme, if we have a Feature WIP of 10, we will split our efforts across ten things, dilluting any kind of focus, and doing many things in parallel.
You should strive for a Feature WIP that is as low as possible, ideally 1 or 2. However, if your reality looks different, it makes more sense to set Lighthouse up accordingly, as otherwise the forecasts will be off.
You may use Lighthouse to make it transparent what a change in Feature WIP can mean in terms of Feature delivery, which could be a good conversation starter to make a change.
If a team is configured to Automatically Adjust Feature WIP, you can still change the settings manually. However, they will be overridden the next time the Team Data will be updated.
Deliveries
Deliveries are named milestone dates for a portfolio that group a set of Features intended to be released together. They help you communicate target dates, track which features belong to a delivery, and see delivery-level progress alongside feature forecasts.
Add a Delivery
To add a delivery to a portfolio, open the portfolio and click the Add Delivery button. This opens the delivery form where you define the delivery name, target date and how features should be selected.
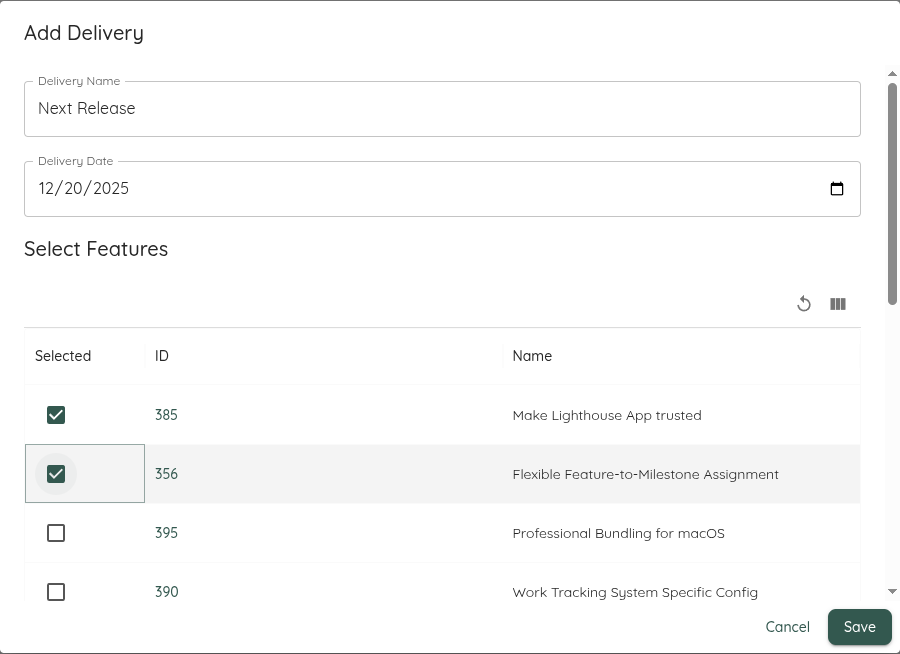
Lighthouse offers two ways to select features for a delivery:
- Manual Selection: Manually pick specific features to include in the delivery. Features remain fixed unless you manually update them.
- Rule-Based Selection: Define rules that automatically match features based on criteria from your work tracking system (Premium feature only).
Manual Delivery Creation
- Click Add Delivery to open the form.
- Ensure Manual mode is selected.
- Fill the required fields: Name (a clear title for the delivery), Date (target delivery date), and Features (select one or more features to include).
- Click Save to create the delivery. The new delivery will appear in the Deliveries list and can be edited or removed later.
You can select multiple features for a single delivery — Lighthouse will show delivery-level progress and the forecasted completion of each included feature.
Rule-Based Delivery Creation
Rule-based deliveries provide a flexible, automated approach to feature selection by defining expressions that match features from your work tracking system. This creates a single source of truth — features are automatically included or excluded based on data already present in your work tracking system (such as tags, fixVersion in Jira, Area Paths in Azure DevOps, or custom fields).
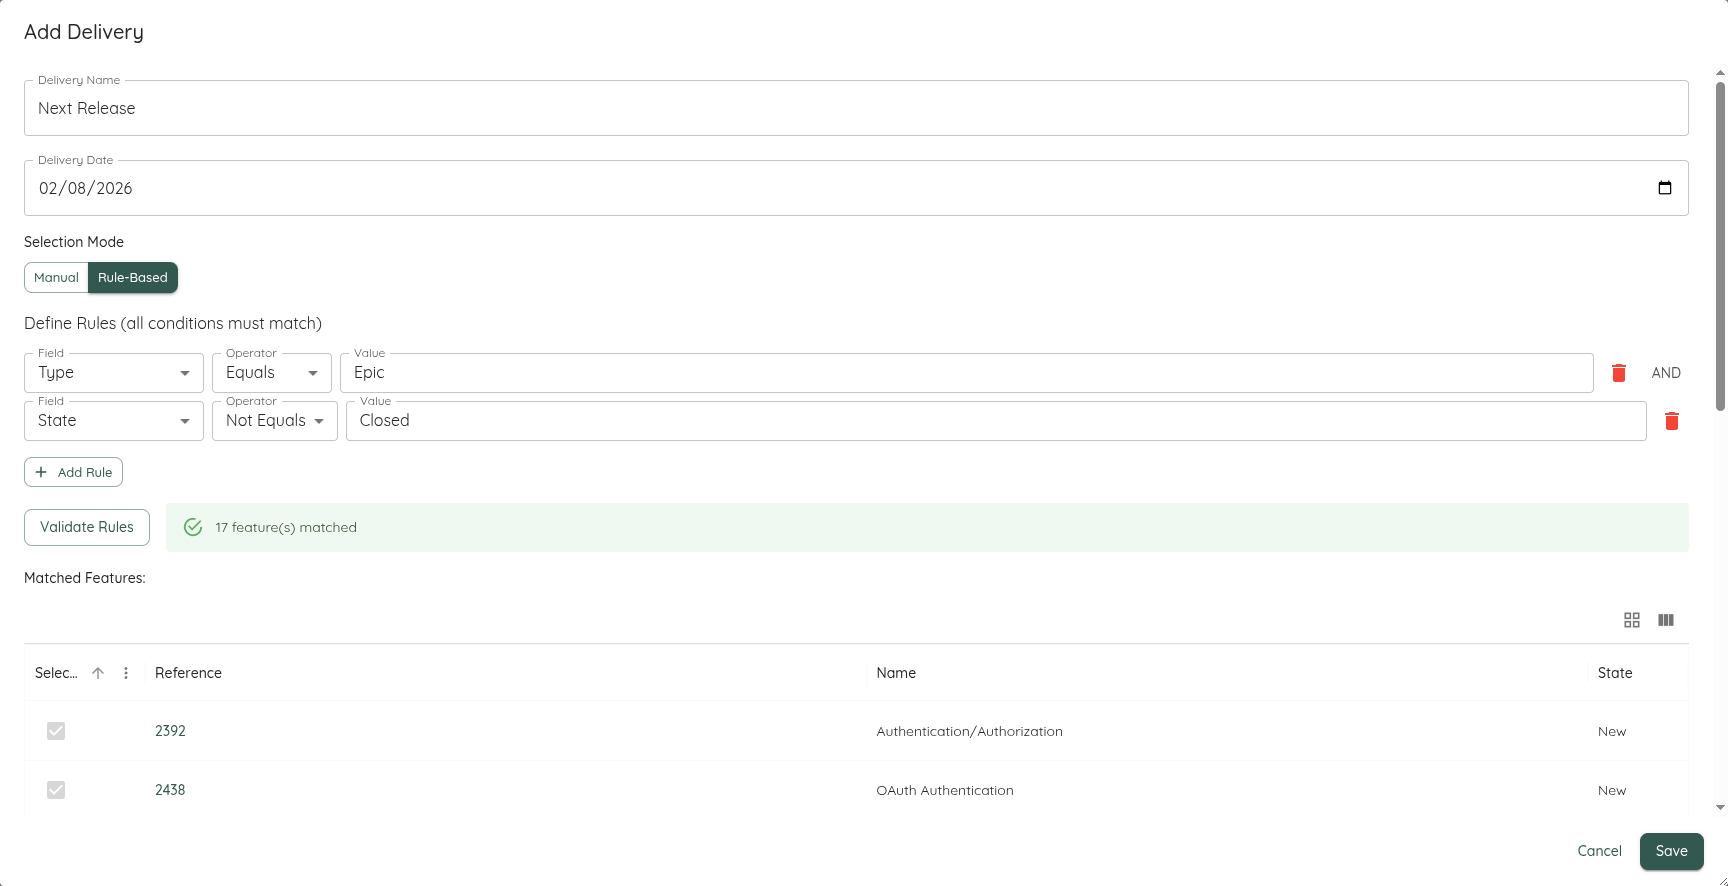
Rule-based deliveries are a Premium feature and require a Premium license.
Creating a Rule-Based Delivery
- Click Add Delivery to open the form.
- Switch to Rule-Based mode by clicking the Rule-Based tab.
- Fill in Name and Date as usual.
- Click Add Rule to create your first rule condition.
- For each rule, select:
- Field: Choose from available fields like Type, State, Tags, Name, ReferenceId, ParentReferenceId, or any custom fields defined in your work tracking system connection.
- Operator: Choose how to match the field value:
- equals: Exact match
- notequals: Does not match
- contains: Partial match (useful for tags or text fields)
- Value: Enter the value to match against (e.g., “Release-2.0” for tags, “Epic” for type).
You can add multiple rules (up to 20). All rules must be satisfied for a feature to be included (rules are combined with AND logic).
Validating Rules
Before saving, click Validate Rules to preview which features match your expression. The matched features will be displayed below the rule builder. At least one feature must match for the rules to be valid.
Use rule-based deliveries when your work tracking system already organizes features by delivery using fields like:
- Jira: fixVersion, labels, or custom fields
- Azure DevOps: Area Paths, tags, or iteration paths
- Custom Fields: Any additional fields you’ve configured in Lighthouse
This approach maintains your work tracking system as the single source of truth and automatically keeps deliveries up-to-date.
Automatic Updates
Rule-based deliveries are automatically updated every time the portfolio is refreshed (either manually or during periodic updates). The rules are re-evaluated against current portfolio features:
- New features matching the rules are automatically added
- Features no longer matching the rules are automatically removed
This ensures your delivery always reflects the current state of your work tracking system without manual maintenance.
It’s a binary choice — each delivery uses either Manual or Rule-Based selection. You cannot mix both approaches for a single delivery, though you can switch between modes when editing a delivery.
After it’s added
After creating a delivery it appears in the Deliveries view with its name, target date and the list of included features.
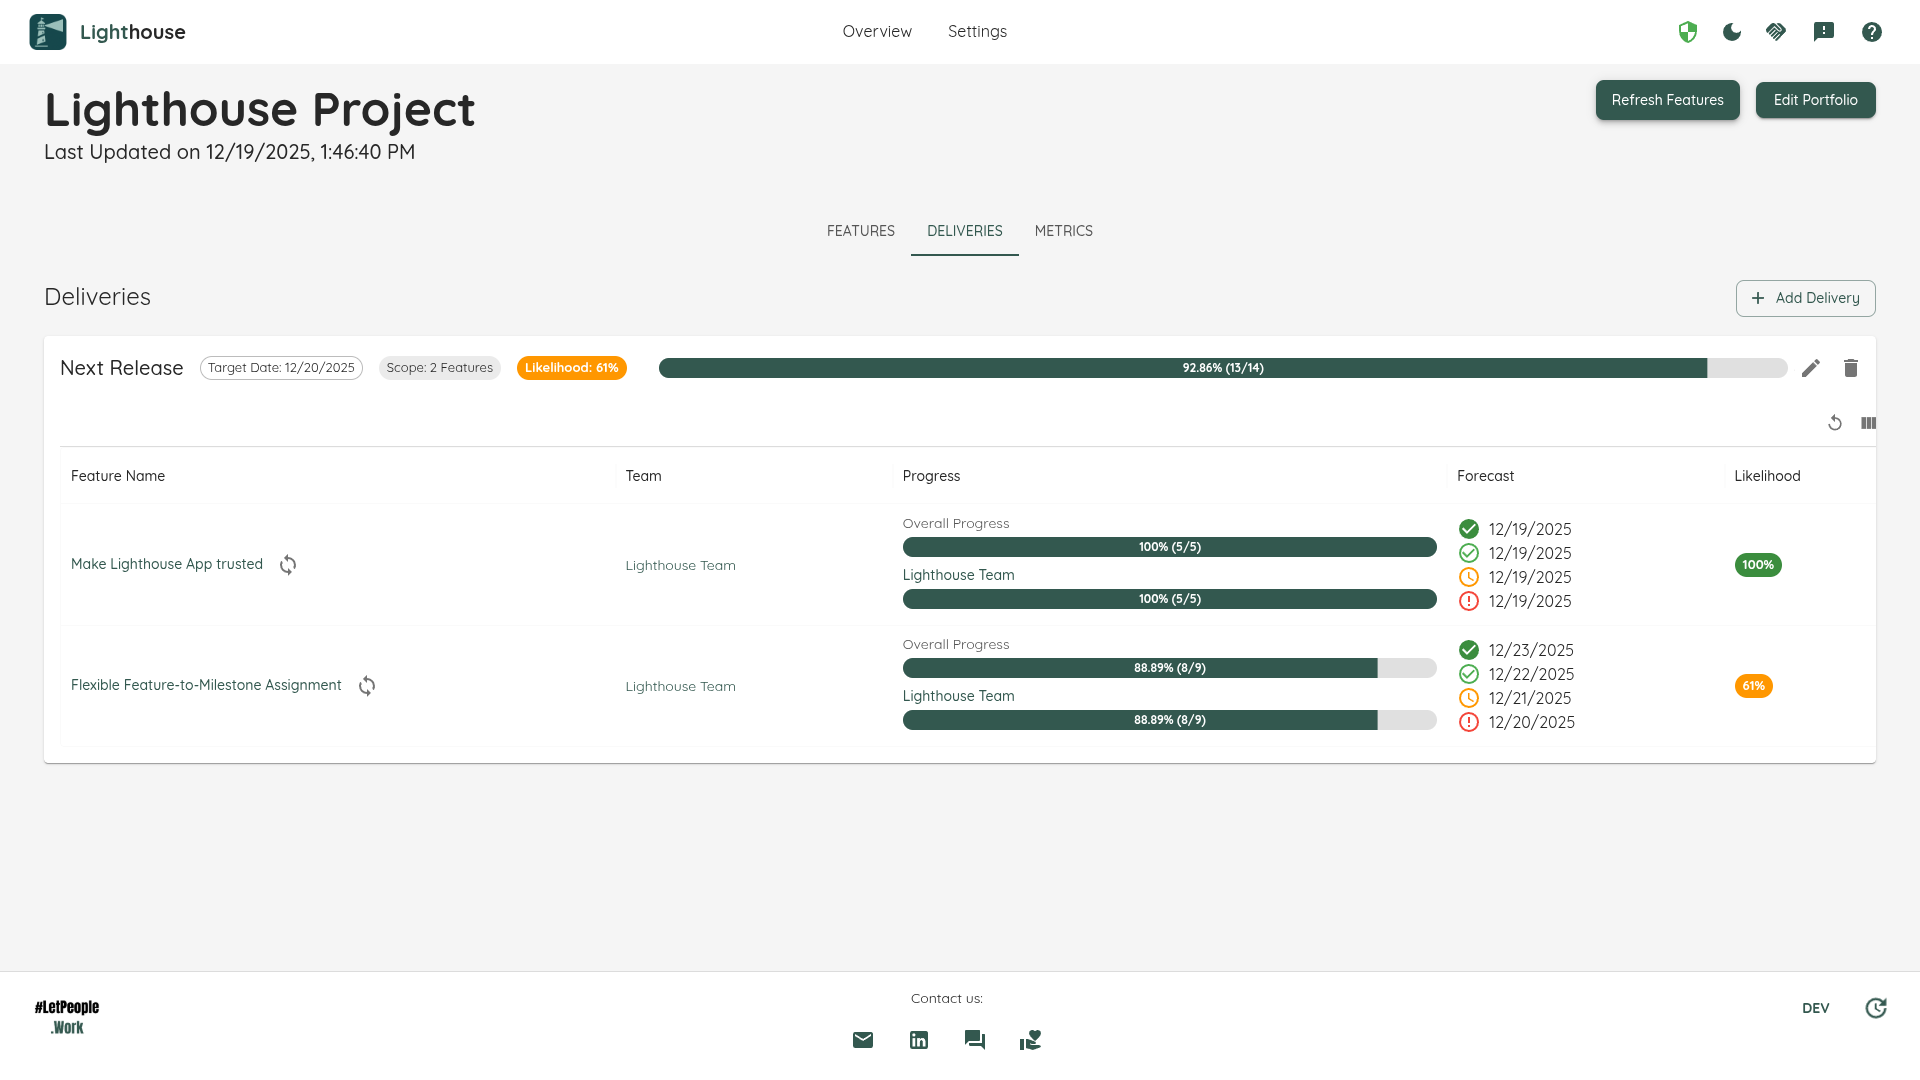
The delivery row shows the delivery name and date, along with a visual indicator showing whether it’s a manual or rule-based delivery:
- Manual deliveries show a touch icon, indicating features are fixed
- Rule-based deliveries show an automatic mode icon, indicating features update automatically based on rules
The row also includes an expand control to reveal included features and their statuses, and action buttons to edit or delete the delivery. Expanding a delivery displays each feature and its forecasted completion so you can assess delivery risk and progress at a glance.
Use deliveries to communicate release milestones and to group related features — this makes it easier to discuss release risk and progress with stakeholders.
Delivery Metrics over Time
Expand a delivery and open its Metrics tab to see how the delivery has tracked over time. Where the feature forecasts answer “where do we stand today?”, these charts answer “how has the picture changed, and is it getting better or worse?”. They build forward from the moment the delivery is created — each daily snapshot adds a point — so the history grows richer the longer a delivery is live.
Burnup
The burnup chart plots total scope against completed work over time.
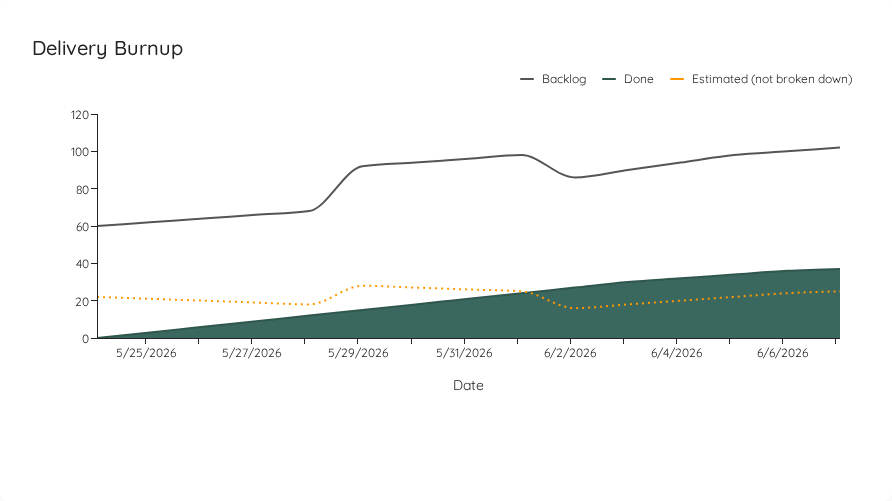
- The Backlog line is the total number of items in the delivery; it rises when scope is added.
- The Done area is how much has been completed.
- A dashed Estimated line appears when the delivery still contains features that have not been broken down, so you can see how much of the scope is a placeholder estimate rather than counted items.
The gap between Backlog and Done is the remaining work — watching the two lines converge (or diverge) tells you whether the delivery is closing in on completion or losing ground to scope growth.
Predictability
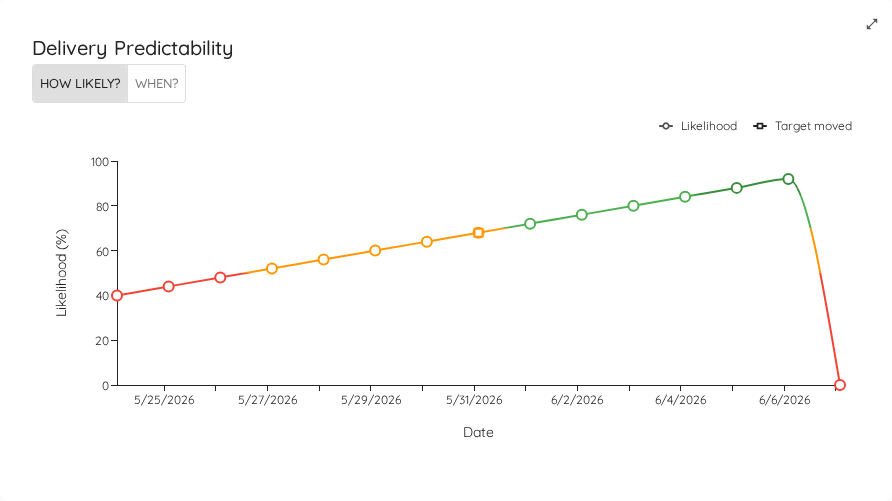
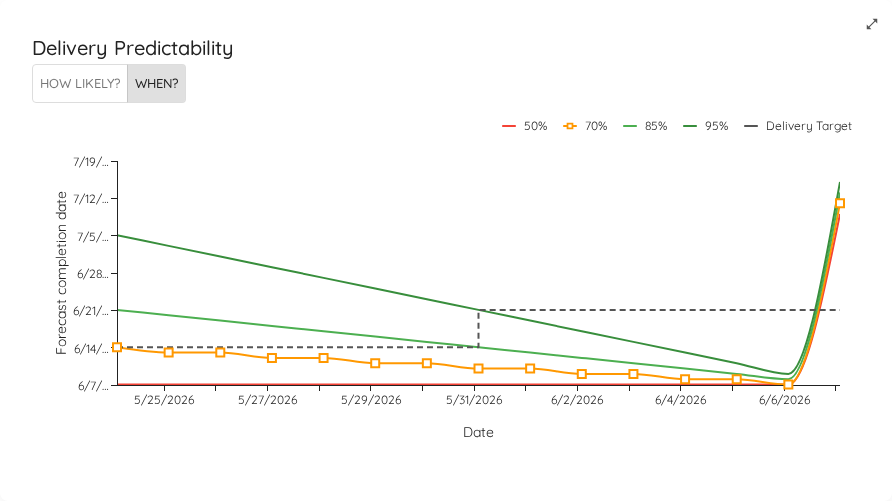
The predictability chart tracks the forecast itself over time and offers two views via the toggle in its header.
How Likely? shows the probability of hitting the target date on each day, plotted against coloured confidence bands (Risky → Certain).
When? shows the forecasted completion dates (50th, 70th, 85th, and 95th percentiles) over time against the delivery’s target date.
Honest charts when the target moves
If you change a delivery’s target date, the charts do not silently rewrite history. The target is recorded as it was on each snapshot, so the target line steps on the day it changed, and a marker highlights the change on the How Likely? view. This keeps the forecast honest: a sudden jump in likelihood is clearly attributable to a moved target rather than to real progress.
Fever Chart
The fever chart places each feature in the delivery on a schedule-versus-confidence plot, coloured green / amber / red by risk, and animates the trail of how that position evolved.
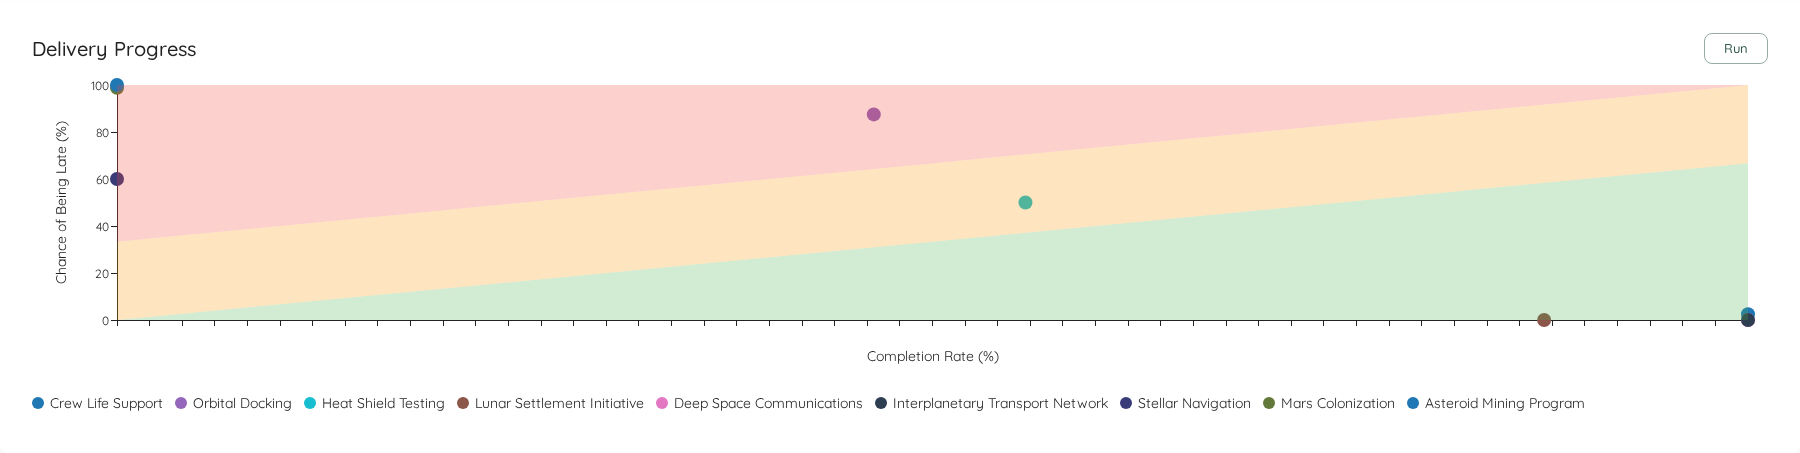
Use the Run control to replay the trail over time. A feature drifting up into the red zone is consuming its buffer faster than it is making progress — an early-warning signal long before the target date arrives.
These charts accrue from the day a delivery is created. A newly added delivery shows an empty state until the first snapshots are recorded — give it a day or two of background updates to populate.
Metrics
Similar to the Team Details, the Portfolio contains metrics. The visuals are mostly the same as for the teams, the difference is that they are applied at feature level on the Portfolio. Check the Metrics Page for more details.