System Info
The System Info tab gives you an overview over your system: 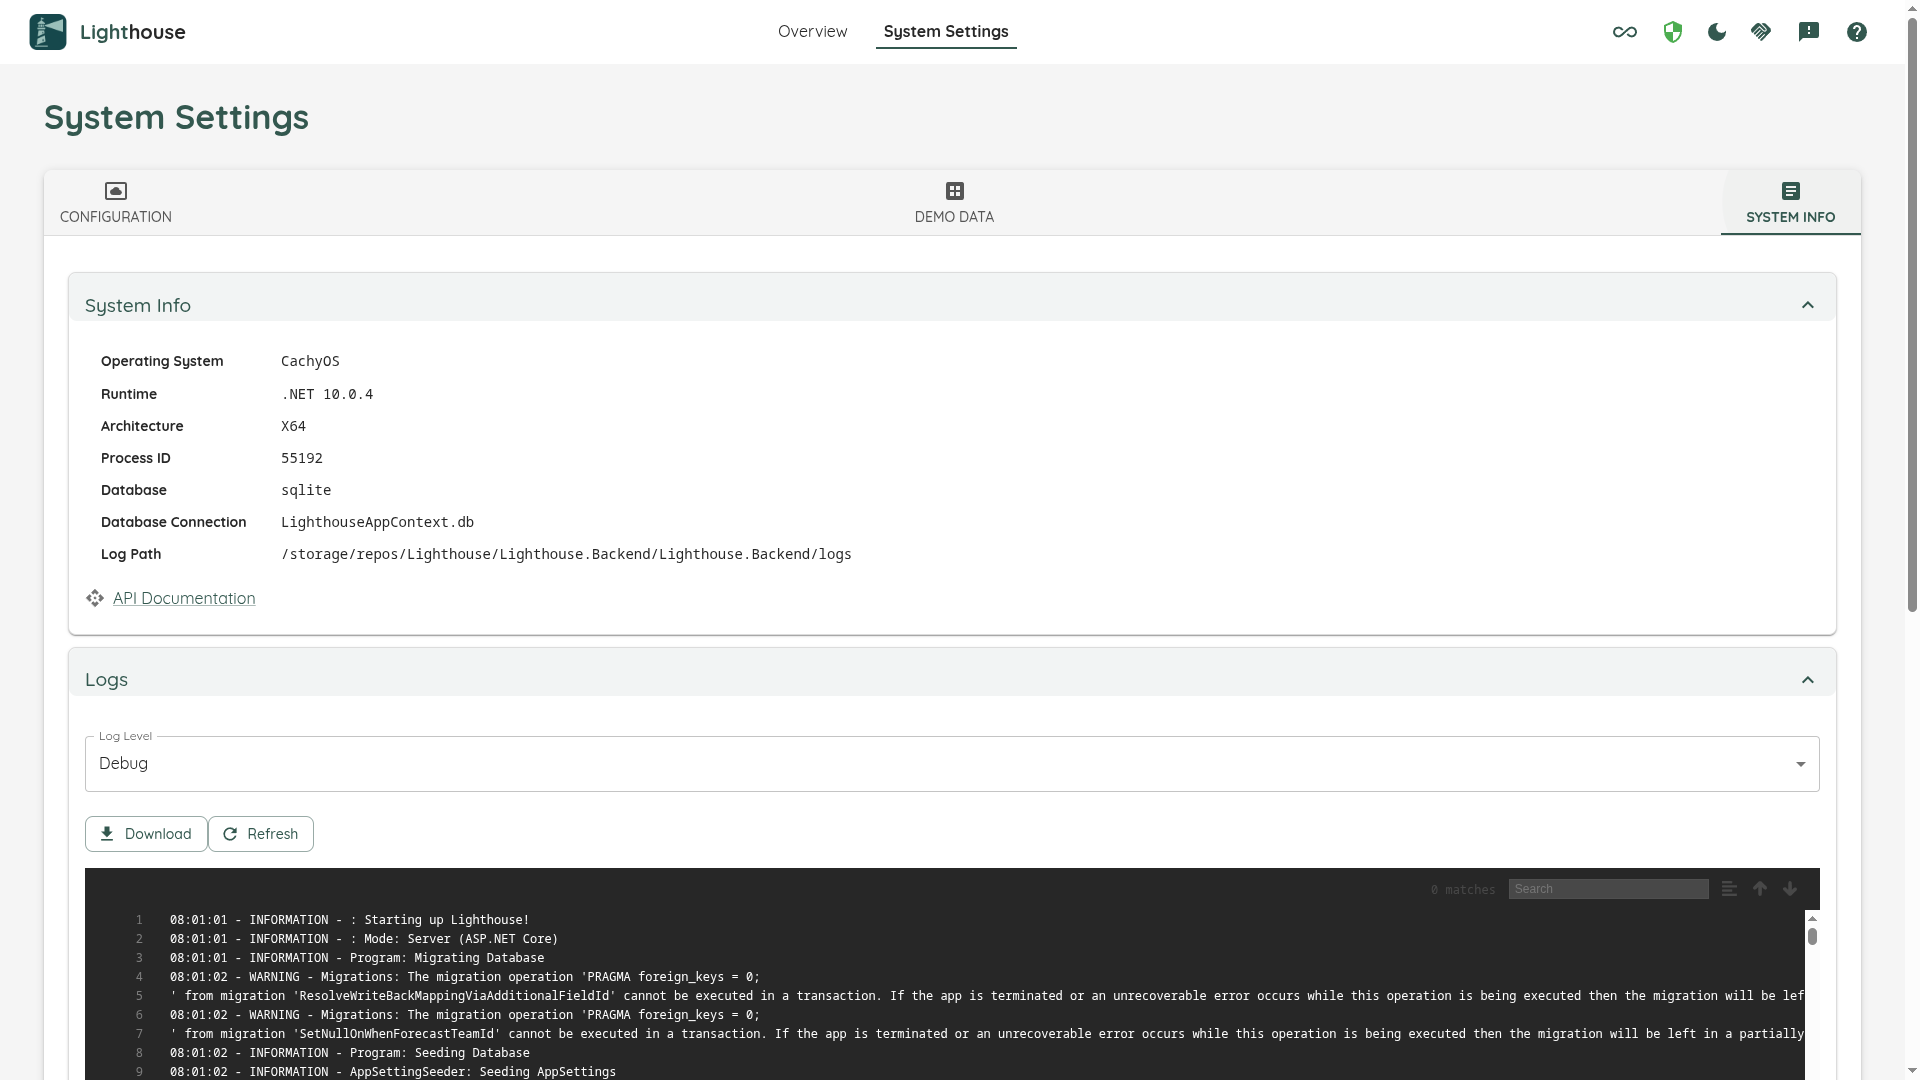
System Info
Here you can see details about the Lighthouse instance you are running.
You can click on any of the values, and it will copy them.
You also have a link to the API documentation, which will bring you to a swagger page detailing all the API endpoints of Lighthouse.
One of the rows is Encryption, and it answers who owns the key your stored credentials are encrypted with — this instance, or you. It is the fastest way to tell whether an instance still needs a key of its own; what to do about the answer is on the Secret Encryption Key page. Like every value here, the row names the key, never the key material.
Refresh History
In order to observe the refresh times of your teams and portfolios, Lighthouse is tracking the last 30 runs and visualizing them:
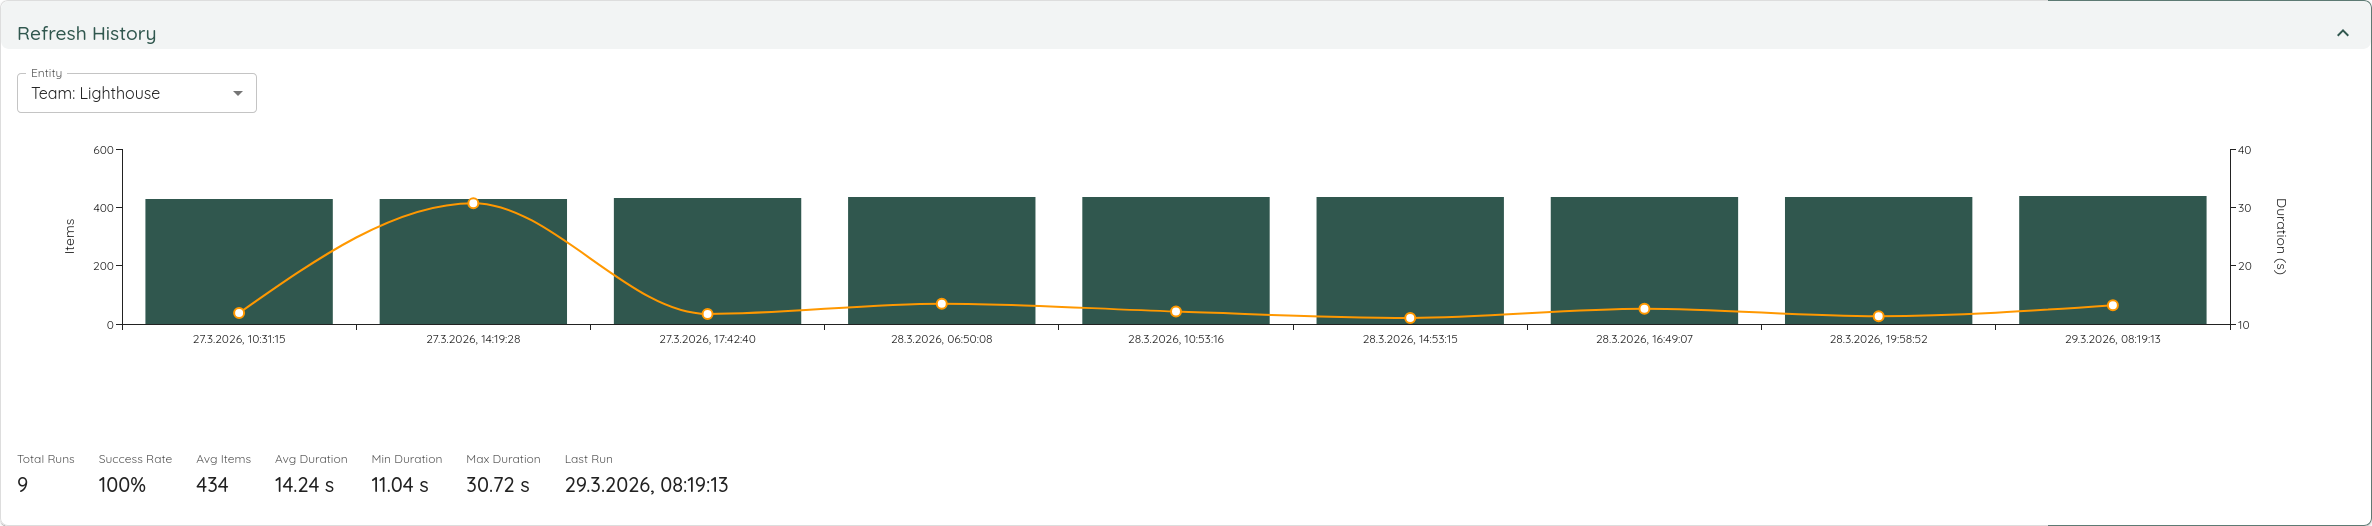
You can see when you refreshed, how many items (Work Items or Features) were fetched, and how long it took.
Logs
We really hope you don’t need this…but then again, Software is complex and it’s very possible that once you run into a problem and need some more details on what was going on (or we ask for this info to better find the problem).
For this case, you can check the Logs.
If you are here because something looks wrong right now, the Task Manager in the header lists the recent warnings and errors on their own, without the rest of the log around them — and it links back to this page when you need the full picture.
Log Level
Log levels describe the level of detail that should end up in the log. The more “sensitive”, the more messages will be added. Following Log Levels can be selected:
| Level | Description |
|---|---|
| Verbose | Most detailed logging level, includes all messages |
| Debug | Includes detailed information useful for debugging |
| Information | General information about application flow |
| Warning | Potentially harmful situations that aren’t errors |
| Error | Error events that might still allow the application to continue |
| Fatal | Very severe errors that will terminate the application |
For normal operations, we recommend to keep the log level at Warning or Information. Debug and Verbose should only be used selectively to analyze errors, as otherwise the log will grow a lot, and most likely you’ll have too much information in there for it to be truly useful.
What an Update Writes
At Information, every completed update writes a single summary line that says what it did:
Update completed | Team 'Zenith' | mode=full | scanned=4013 | fetched=4013 | duration=291043ms | success=True
| Field | Meaning |
|---|---|
mode | How much had to be fetched. full downloads every record the query returned; delta downloads only the ones that changed since the last update. See Faster Updates |
scanned | How many records the work tracking system returned |
fetched | How many of those were downloaded in full |
duration | How long the update took, in milliseconds |
success | Whether it completed. A failed update still writes this line, followed by the error |
This is the line to read if you want to know whether your refresh interval is affordable, or which Team or Portfolio is the expensive one.
The detail of what an update touched — every Work Item added, updated or removed, every Feature it extrapolated — is written at Debug, not Information. Nothing was removed; if you are chasing a specific Work Item through an update, switch to Debug and you will find it. An update that is skipped because it is not due yet writes nothing at Information at all.
View Logs
You can check the Live Logs in the built-in Log View. This also supports a Search with syntax highlighting, for example if you want to find a specific feature by name or ID.
The latest logs are the bottom of the Log Viewer. So for newer things you have to scroll down
The logs won’t be updated automatically. If you want to get the latest ones, hit the Refresh button and the viewer will reload the latest ones.
Download
For a quick glance, the built-in Log Viewer is nice. However, for some extended analysis or to provide Logs to other people (for example as part of a bug report), you can download the full Log file. Simply hit the Download button, and the file will be downloaded to your computer.